


Mumbai, August 06, 2026: Pharma major Lupin Limited [BSE: 500257 | NSE: LUPIN] reported its financial performance for the quarter ending June 30, 2026. These unaudited results were taken on record by the Board of Directors at a meeting held today.
Financial Highlights – Consolidated IND-AS
Amt in INR Mn
| Particulars | Q1 FY2027 | Q1 FY2026 | YoY Growth % | Q4 FY2026 | QoQ Growth % |
| Sales | 82,172 | 61,638 | ↑ 33.3% | 73,919 | ↑ 11.2% |
| EBITDA* | 25,799 | 18,063 | ↑ 42.8% | 26,263 | ↓ 1.8% |
| EBITDA Margin (%)* | 31.4% | 29.3% | ↑ 210 bps | 35.5% | ↓ 410 bps |
| PBT | 20,174 | 14,155 | ↑ 42.5% | 19,280 | ↑ 4.6% |
| PAT | 14,170 | 12,215 | ↑ 16.0% | 14,687 | ↓ 3.5% |
*Includes forex & other income
Income Statement Highlights – Q1 FY2027
Consolidated Financial Results Q1 FY2027
Amt in INR Mn
| Particulars | Q1 FY2027 | % of sales | Q1 FY2026 | % of sales | YoY Growth% | Q4 FY2026 | % of sales | QoQ Growth% |
| Sales | 82,172 | 100.0% | 61,638 | 100.0% | ↑ 33.3% | 73,919 | 100.0% | ↑ 11.2% |
| Other operating income | 597 | 0.7% | 1,045 | 1.7% | ↓ 42.9% | 828 | 1.1% | ↓ 27.9% |
| Total Revenue from operations | 82,769 | 100.7% | 62,683 | 101.7% | ↑ 32.0% | 74,747 | 101.1% | ↑ 10.7% |
| Material cost | 20,892 | 25.4% | 17,719 | 28.7% | ↑ 17.9% | 18,516 | 25.0% | ↑ 12.8% |
| Gross Profit (Excl. Other op. income) | 61,280 | 74.6% | 43,919 | 71.3% | ↑ 39.5% | 55,403 | 75.0% | ↑ 10.6% |
| Employee cost | 13,830 | 16.8% | 10,830 | 17.6% | ↑ 27.7% | 12,427 | 16.8% | ↑ 11.3% |
| Manufacturing & Other expenses | 23,412 | 28.5% | 17,720 | 28.7% | ↑ 32.1% | 22,093 | 29.9% | ↑ 6.0% |
| Other Income | 1,303 | 1.6% | 790 | 1.3% | ↑ 64.9% | 1,407 | 1.9% | ↓ 7.4% |
| Forex Loss / (Gain) | 139 | 0.2% | (859) | -1.4% | ↓116.2% | (3,145) | -4.3% | ↓ 104.4% |
| EBITDA | 25,799 | 31.4% | 18,063 | 29.3% | ↑ 42.8% | 26,263 | 35.5% | ↓ 1.8% |
| Depreciation, Amortization & Impairment Expense | 4,529 | 5.5% | 2,990 | 4.9% | ↑ 51.5% | 4,468 | 6.0% | ↑ 1.4% |
| EBIT | 21,270 | 25.9% | 15,073 | 24.5% | ↑ 41.1% | 21,795 | 29.5% | ↓ 2.4% |
| Finance cost | 1,096 | 1.3 % | 918 | 1.5% | ↑ 19.4% | 1,202 | 1.6% | ↓ 8.8% |
| Profit Before Tax (PBT) and Exceptional items | 20,174 | 24.6% | 14,155 | 23.0% | ↑ 42.5% | 20,593 | 27.9% | ↓ 2.0% |
| Exceptional items (Net) | - | - | - | - | - | 1,313 | 1.8% | ↓100.0% |
| Profit Before Tax (PBT) | 20,174 | 24.6% | 14,155 | 23.0% | ↑ 42.5% | 19,280 | 26.1% | ↑ 4.6% |
| Tax | 6,004 | 7.3% | 1,940 | 3.1% | ↑ 209.5% | 4,593 | 6.2% | ↑ 30.7% |
| Profit After Tax (PAT) | 14,170 | 17.2% | 12,215 | 19.8% | ↑ 16.0% | 14,687 | 19.9% | ↓3.5% |
| (-) Share of Loss from JV | 0 | 0.0% | - | - | - | - | - | - |
| (-) Non-Controlling Interest | 20 | 0.0% | 24 | 0.0% | ↓ 16.7% | 83 | 0.1% | ↓ 75.9% |
| Profit/(Loss) for the period | 14,150 | 17.2% | 12,191 | 19.8% | ↑ 16.1% | 14,604 | 19.8% | ↓ 3.1% |
Amt in INR Mn
| Particulars | Q1 FY2027 | Q1 FY2026 | Growth YOY | Q4 FY2026 | Growth QOQ |
| U.S. | 34,348 | 24,041 | 42.9% | 33,987 | 1.1% |
| India | 23,796 | 20,894 | 13.9% | 19,082 | 24.7% |
| Other Developed Markets | 11,494 | 7,748 | 48.3% | 8,453 | 36.0% |
| Emerging Markets | 9,897 | 6,524 | 51.7% | 9,906 | -0.1% |
| Total Formulations | 79,535 | 59,207 | 34.3% | 71,428 | 11.3% |
| API | 2,637 | 2,431 | 8.5% | 2,491 | 5.9% |
| Total Product Sales | 82,172 | 61,638 | 33.3% | 73,919 | 11.2% |
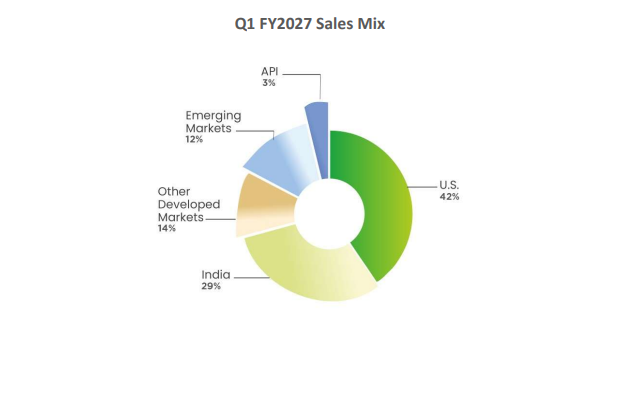
Q1 FY2027 – Sales Mix
Operational Highlights
U.S.
U.S. sales for Q1 FY2027 were INR 34,348 Mn up 42.9% compared to INR 24,041 Mn in Q1 FY2026; (USD 366 Mn in Q1 FY2027 compared with USD 282 Mn in Q1 FY2026); accounting for 42% of Lupin's global sales.
The Company received 6 ANDA approvals from the U.S. FDA, and launched 3 products in the quarter in the U.S. The Company now has 149 generic products in the U.S Market.
Lupin continues to be the 3rd largest pharmaceutical player in both U.S. generic market and U.S. total market by prescriptions (IQVIA Quarter June 2026). Lupin is the leader in 56 of its marketed generics in the U.S. and amongst the Top 3 in 112 of its marketed products (IQVIA Quarter June 2026 by extended units).
India
India sales for Q1 FY2027 were INR 23,796 Mn, up 13.9% compared to INR 20,894 Mn in Q1 FY2026; accounting for 29% of Lupin's global sales. India Region Formulation sales up by 15.1% in the quarter as compared to Q1 FY2026.
The Company launched 7 brands across therapies during the quarter. Lupin is the 8th largest company in the Indian Pharmaceutical Market (IQVIA MAT June 2026).
Other Developed Markets
Other Developed markets sales for Q1 FY2027 were INR 11,494 Mn, up 48.3% compared to INR 7,748 Mn in Q1 FY2026; accounting for 14% of Lupin's global sales.
Emerging Markets
Emerging Markets sales for Q1 FY2027 were INR 9,897 Mn, up 51.7% compared to INR 6,524 Mn in Q1 FY2026; accounting for 12% of Lupin's global sales.
Global API
Global API sales for Q1 FY2027 were INR 2,637 Mn, up 8.5% compared to INR 2,431 Mn in Q1 FY2026; accounting for 3% of Lupin's global sales.
Research and Development
Investment in R&D was INR 6,077 Mn (7.4% of sales) for the quarter as compared to INR 4,975 Mn (8.1% of sales) for Q1 FY2026.
Lupin received approval for 6 ANDAs from the U.S. FDA in the quarter. Cumulative ANDA filings with the U.S. FDA stand at 429 as of June 30, 2026, with the company having received 350 approvals to date.
The Company now has 50 First-to-File (FTF) filings including 21 exclusive FTF opportunities. Cumulative U.S. DMF filings stand at 94 as of June 30, 2026.
About Lupin
Lupin Limited is a global pharmaceutical leader headquartered in Mumbai, India, with products distributed in over 100 markets. Lupin specializes in pharmaceutical products, including branded and generic formulations, complex generics, biotechnology products, and active pharmaceutical ingredients. Trusted by healthcare professionals and consumers globally, the company enjoys a strong position in India and the U.S. across multiple therapy areas, including respiratory, cardiovascular, anti-diabetic, anti-infective, gastrointestinal, central nervous system, and women's health. Lupin has 15 state-of-the-art manufacturing sites and 7 research centers globally, along with a dedicated workforce of over 26,000 professionals. Lupin is committed to improving patient health outcomes through its subsidiaries - Lupin Diagnostics, Lupin Digital Health, and Lupin Manufacturing Solutions.
To know more, visit www.lupin.com or follow us on LinkedIn https://www.linkedin.com/company/lupin
For further information or queries please contact –
Rajalakshmi Azariah
Vice President & Global Head – Corporate Communications, Lupin
rajalakshmiazariah@lupin.com